Every submission tells a story.
Explore your data through maps, charts, and tables. See who submitted, where and what matters most.
Your entire operation, visualized.
Dive into a live demo and see how data turns into instant insights, complete with charts and maps.
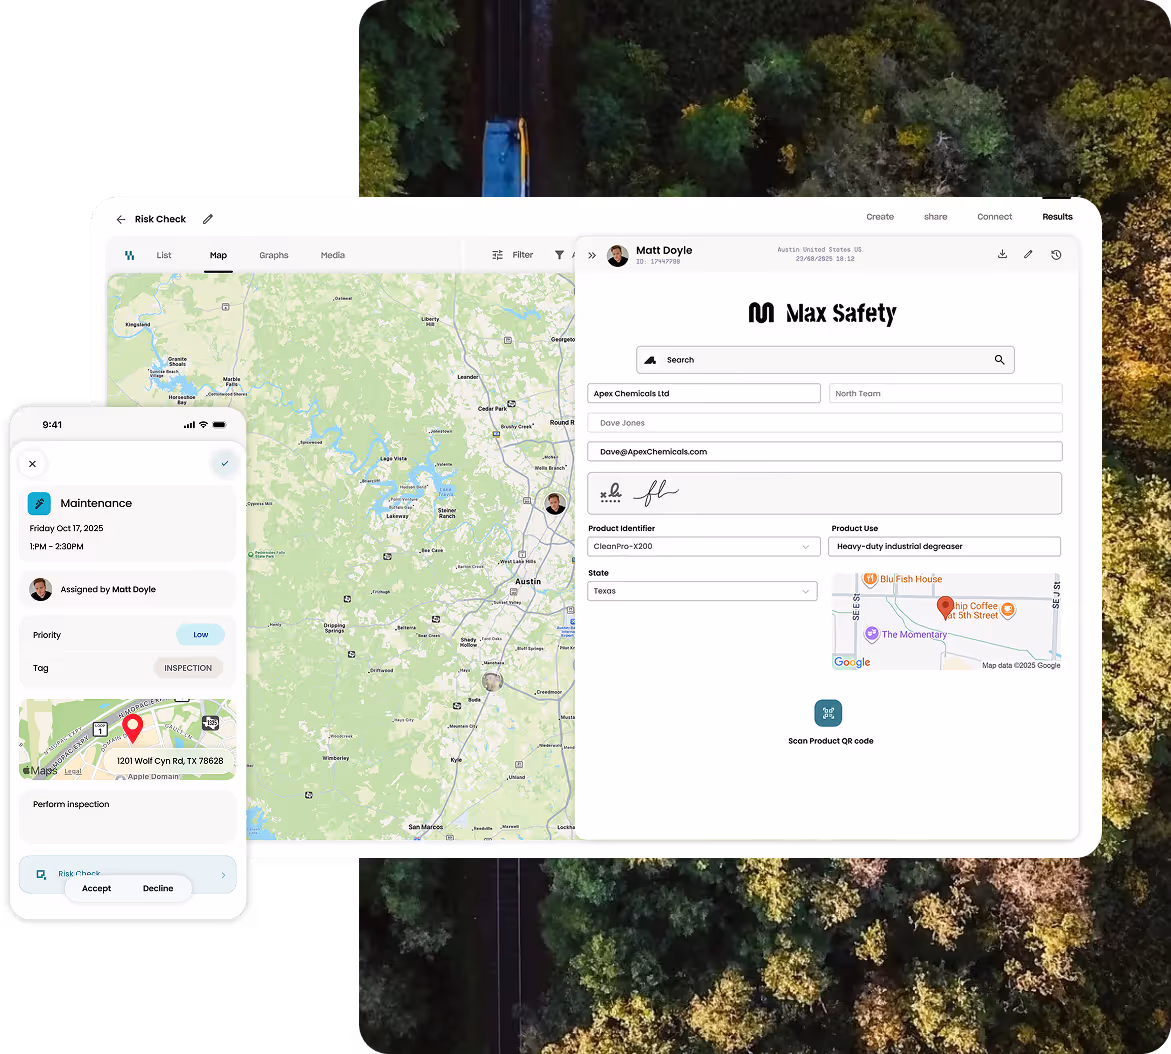
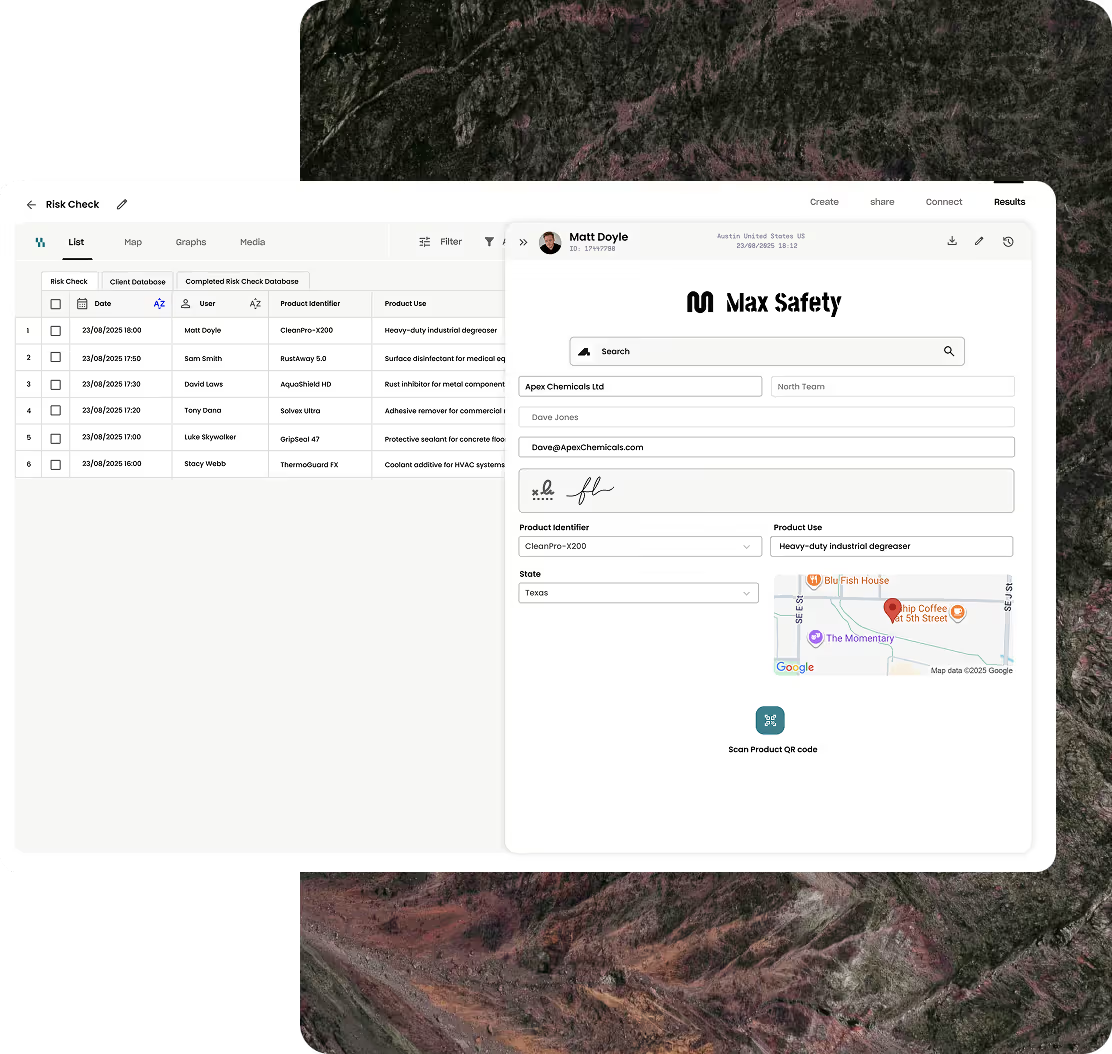
See Every Submission in One Place
Get instant visibility into all your form submissions as they come in — live. The Reports area gives you a centralized view of every response, so you can easily monitor activity, track performance and stay up to date across your teams and projects.
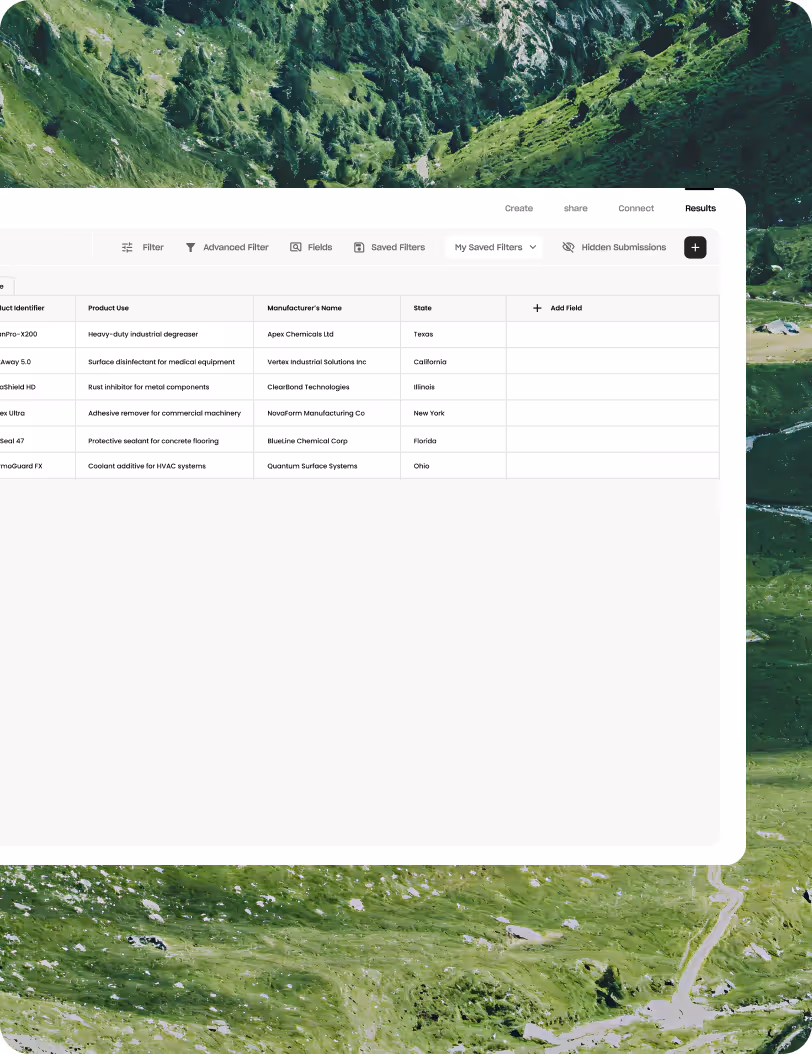
Filter, Sort, and Export With Ease
Drill down into your data with powerful filters and sorting options. Find exactly what you need in seconds, then export your results to Excel, CSV, or PDF with a single click. Whether you’re analyzing numbers or archiving records, Array makes it effortless.
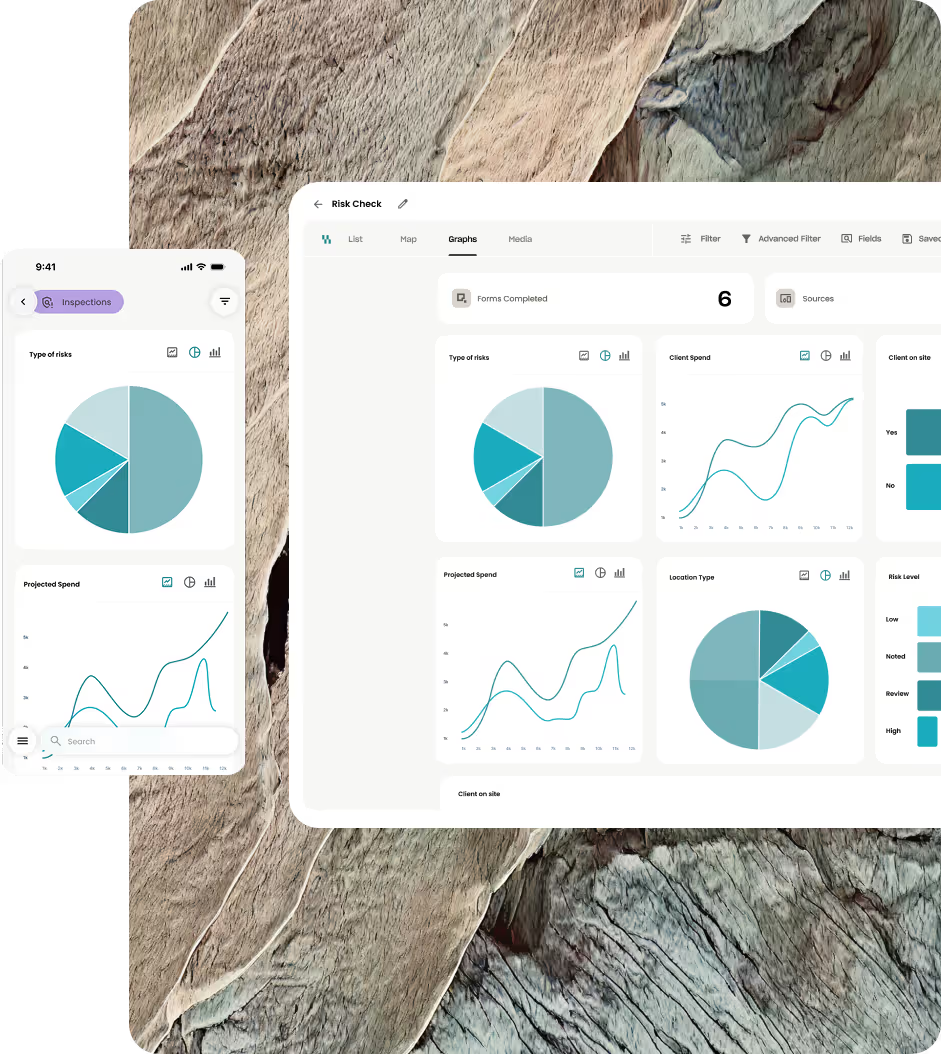
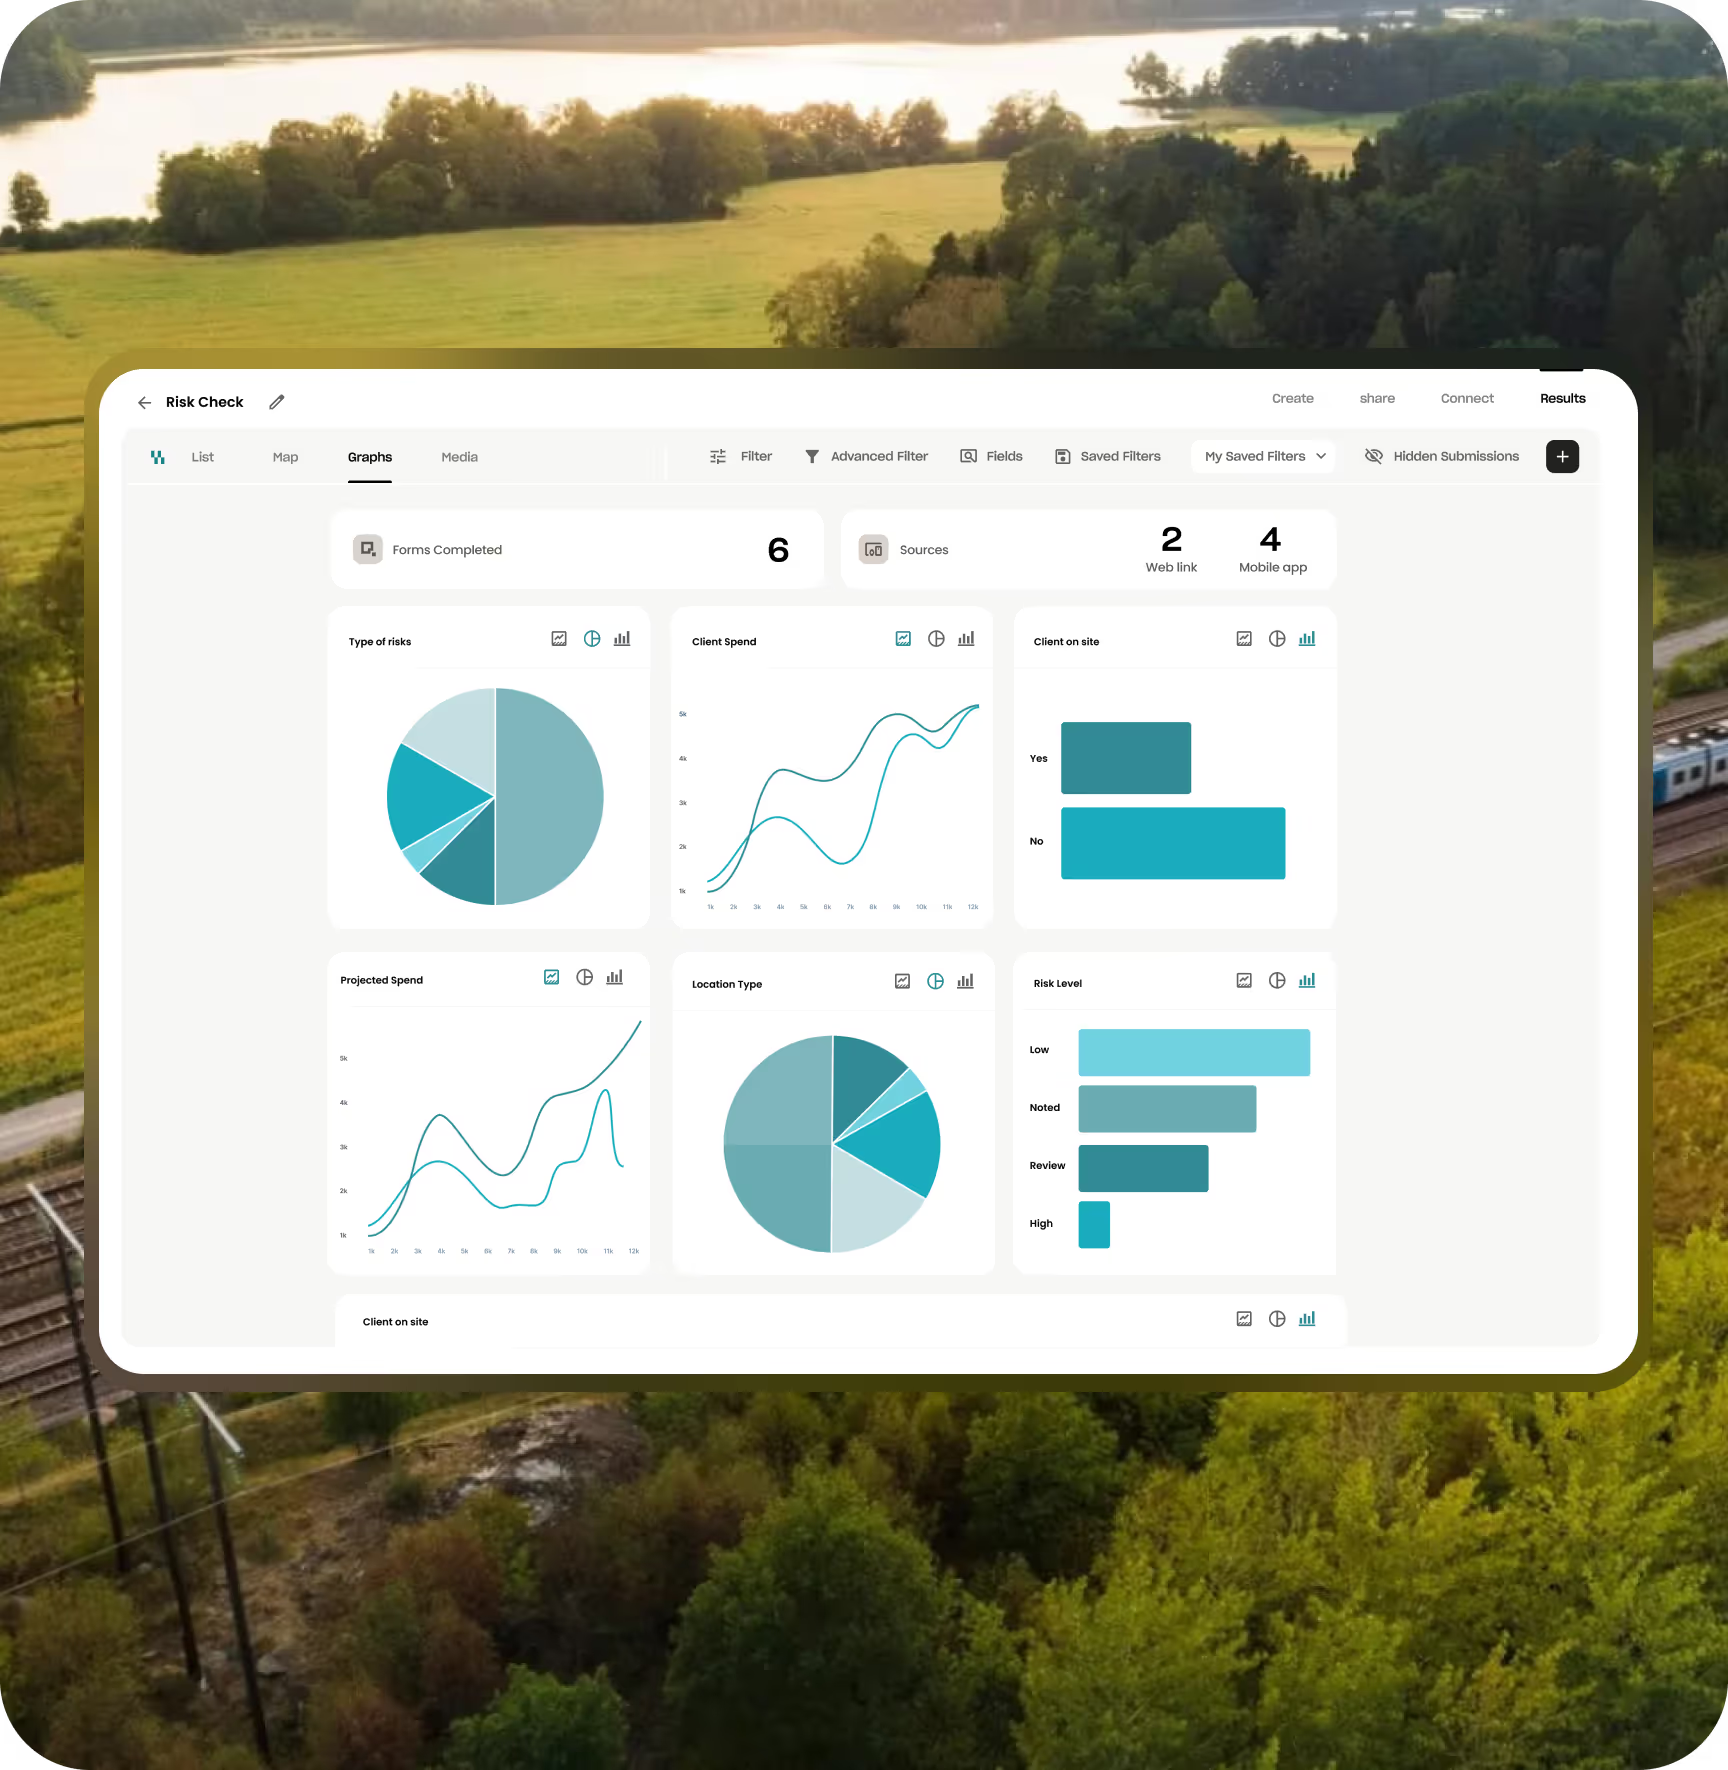
Visualise Your Data Instantly
Turn your submissions into insights. Array automatically generates interactive graphs, pie charts and dashboards so you can visualize trends, measure progress and share insights without leaving the platform.
Map & Connect Your Data
See where your data lives — literally. Switch to a map view to track location-based submissions or display relational data between multiple forms. Every data point, every relationship, every region — all visualized in real time to help you make smarter, faster decisions.